The Power of IoT Data Visualization
In today’s data-driven world, the Internet of Things (IoT) has revolutionized the way we interact with and understand our physical environment. Billions of connected devices, from smart home appliances to industrial sensors, are generating a constant stream of data, offering unprecedented insights into everything from energy consumption to asset performance. However, the sheer volume and complexity of this IoT data can be overwhelming, making it crucial to harness the power of data visualization to unlock its true potential.
IoT data visualization is the art of transforming raw sensor data into intuitive, interactive visual representations that enable faster decision-making and improved operational efficiency. By leveraging advanced visualization tools and techniques, businesses can quickly identify patterns, detect anomalies, and predict future trends, empowering them to make smarter and more informed decisions.
Unlocking Insights: The Transformative Power of IoT Visualization
The Internet of Things has ushered in a new era of data-driven decision-making, where every connected device becomes a sensor, continuously generating valuable information about the world around us. However, the true power of IoT lies not just in the data itself, but in the ability to extract meaningful insights from this deluge of information.
IoT data visualization plays a crucial role in this process, transforming complex, multidimensional data into intuitive, visually appealing representations that are easy to interpret and act upon. From real-time dashboards that provide a comprehensive overview of system performance to predictive analytics that forecast equipment failures, these visual tools unlock a treasure trove of insights, enabling businesses to optimize operations, enhance customer experiences, and drive sustainable growth.
Revolutionizing Industries: IoT Visualization in Action
The applications of IoT data visualization are far-reaching, spanning a diverse range of industries and sectors. Let’s explore some of the transformative ways in which this technology is reshaping the way we approach various challenges:
Smart Cities and Infrastructure
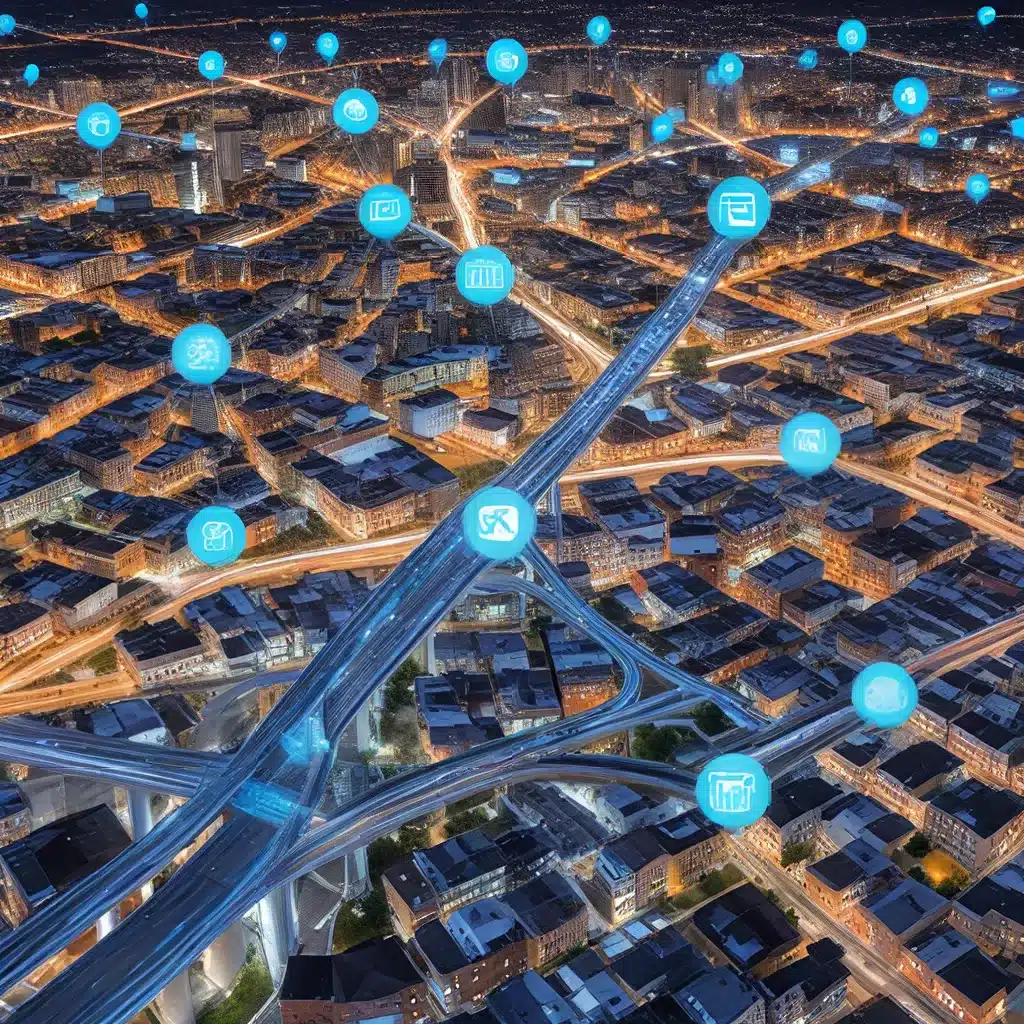
In the realm of smart cities, IoT sensors and visualization tools work in tandem to create a holistic understanding of urban environments. Real-time dashboards display traffic patterns, energy consumption, and environmental data, empowering city planners to make informed decisions about infrastructure, resource allocation, and sustainability initiatives.
Industrial IoT and Asset Management
For industrial IoT applications, visual analytics are instrumental in monitoring equipment health, predicting maintenance needs, and optimizing production workflows. Predictive maintenance informed by IoT data visualization helps reduce downtime, enhance operational efficiency, and extend the lifespan of critical assets.
Healthcare and Wellness
In the healthcare sector, IoT-powered wearables and remote monitoring devices generate a continuous stream of patient data. Visualizing this information in intuitive dashboards and charts enables healthcare providers to identify trends, track progress, and deliver personalized, proactive care, ultimately improving patient outcomes.
Agriculture and Environmental Monitoring
The IoT revolution has also reached the agricultural realm, with sensors monitoring soil conditions, crop health, and weather patterns. Geospatial visualizations and real-time analytics empower farmers to make data-driven decisions, optimize resource allocation, and enhance sustainability efforts.
Overcoming Challenges: Building Robust IoT Visualization Ecosystems
As the IoT landscape continues to evolve, organizations face a unique set of challenges when it comes to data visualization. Handling the sheer volume and velocity of IoT data, ensuring real-time performance, and maintaining data accuracy are just a few of the hurdles that must be overcome.
To address these challenges, IoT ecosystems are leveraging a combination of cloud computing, edge processing, and advanced analytics technologies. Data aggregation platforms and interactive dashboards are designed to process and display real-time information effectively, ensuring that decision-makers have access to the most up-to-date insights.
Moreover, the integration of machine learning and predictive analytics into IoT visualization tools enhances their capabilities. By identifying patterns and forecasting future trends, these AI-powered solutions enable proactive decision-making and adaptive visualizations that evolve based on data insights.
Maintaining the security and integrity of IoT data is also a critical consideration. Robust data pipelines, secure cloud storage, and access controls are essential to safeguarding sensitive information and ensuring the trustworthiness of the visualized data.
The Future of IoT Data Visualization: Empowering Smarter and More Efficient Ecosystems
As the IoT revolution continues to unfold, the role of data visualization in unlocking the full potential of connected devices will only grow more crucial. By transforming complex, multidimensional data into intuitive, interactive visuals, organizations can harness the power of real-time insights and predictive analytics to drive informed decision-making, enhance operational efficiency, and unlock new avenues for innovation.
The future of IoT data visualization promises to be a symphony of interconnected systems, adaptive visualizations, and data-driven intelligence. As the number of connected devices continues to skyrocket, the need for robust, scalable, and secure visualization platforms will become paramount, empowering businesses, cities, and individuals to navigate the data-driven landscape with confidence and clarity.
By embracing the transformative power of IoT data visualization, organizations can unlock a new era of smarter, more efficient operations, ultimately paving the way for a future where every connected device becomes a gateway to a deeper understanding of our world.
Conclusion: Harnessing the Power of IoT Visualization
The Internet of Things has ushered in a data-driven revolution, transforming the way we interact with and monitor our physical environment. However, the true value of IoT lies not just in the data itself, but in the ability to extract meaningful insights and drive actionable decisions through the power of data visualization.
By leveraging advanced visualization tools and techniques, businesses, cities, and individuals can unlock a treasure trove of insights, enabling them to optimize operations, enhance customer experiences, and drive sustainable growth. From real-time dashboards to predictive analytics, IoT data visualization is revolutionizing industries, empowering decision-makers to navigate the data-driven landscape with confidence and clarity.
As the IoT ecosystem continues to evolve, the importance of robust, scalable, and secure visualization platforms will only grow more crucial. By embracing this transformative technology, organizations can unlock a future where every connected device becomes a gateway to a deeper understanding of our world, leading to smarter, more efficient solutions that address the complex challenges of our time.